First download of each R version
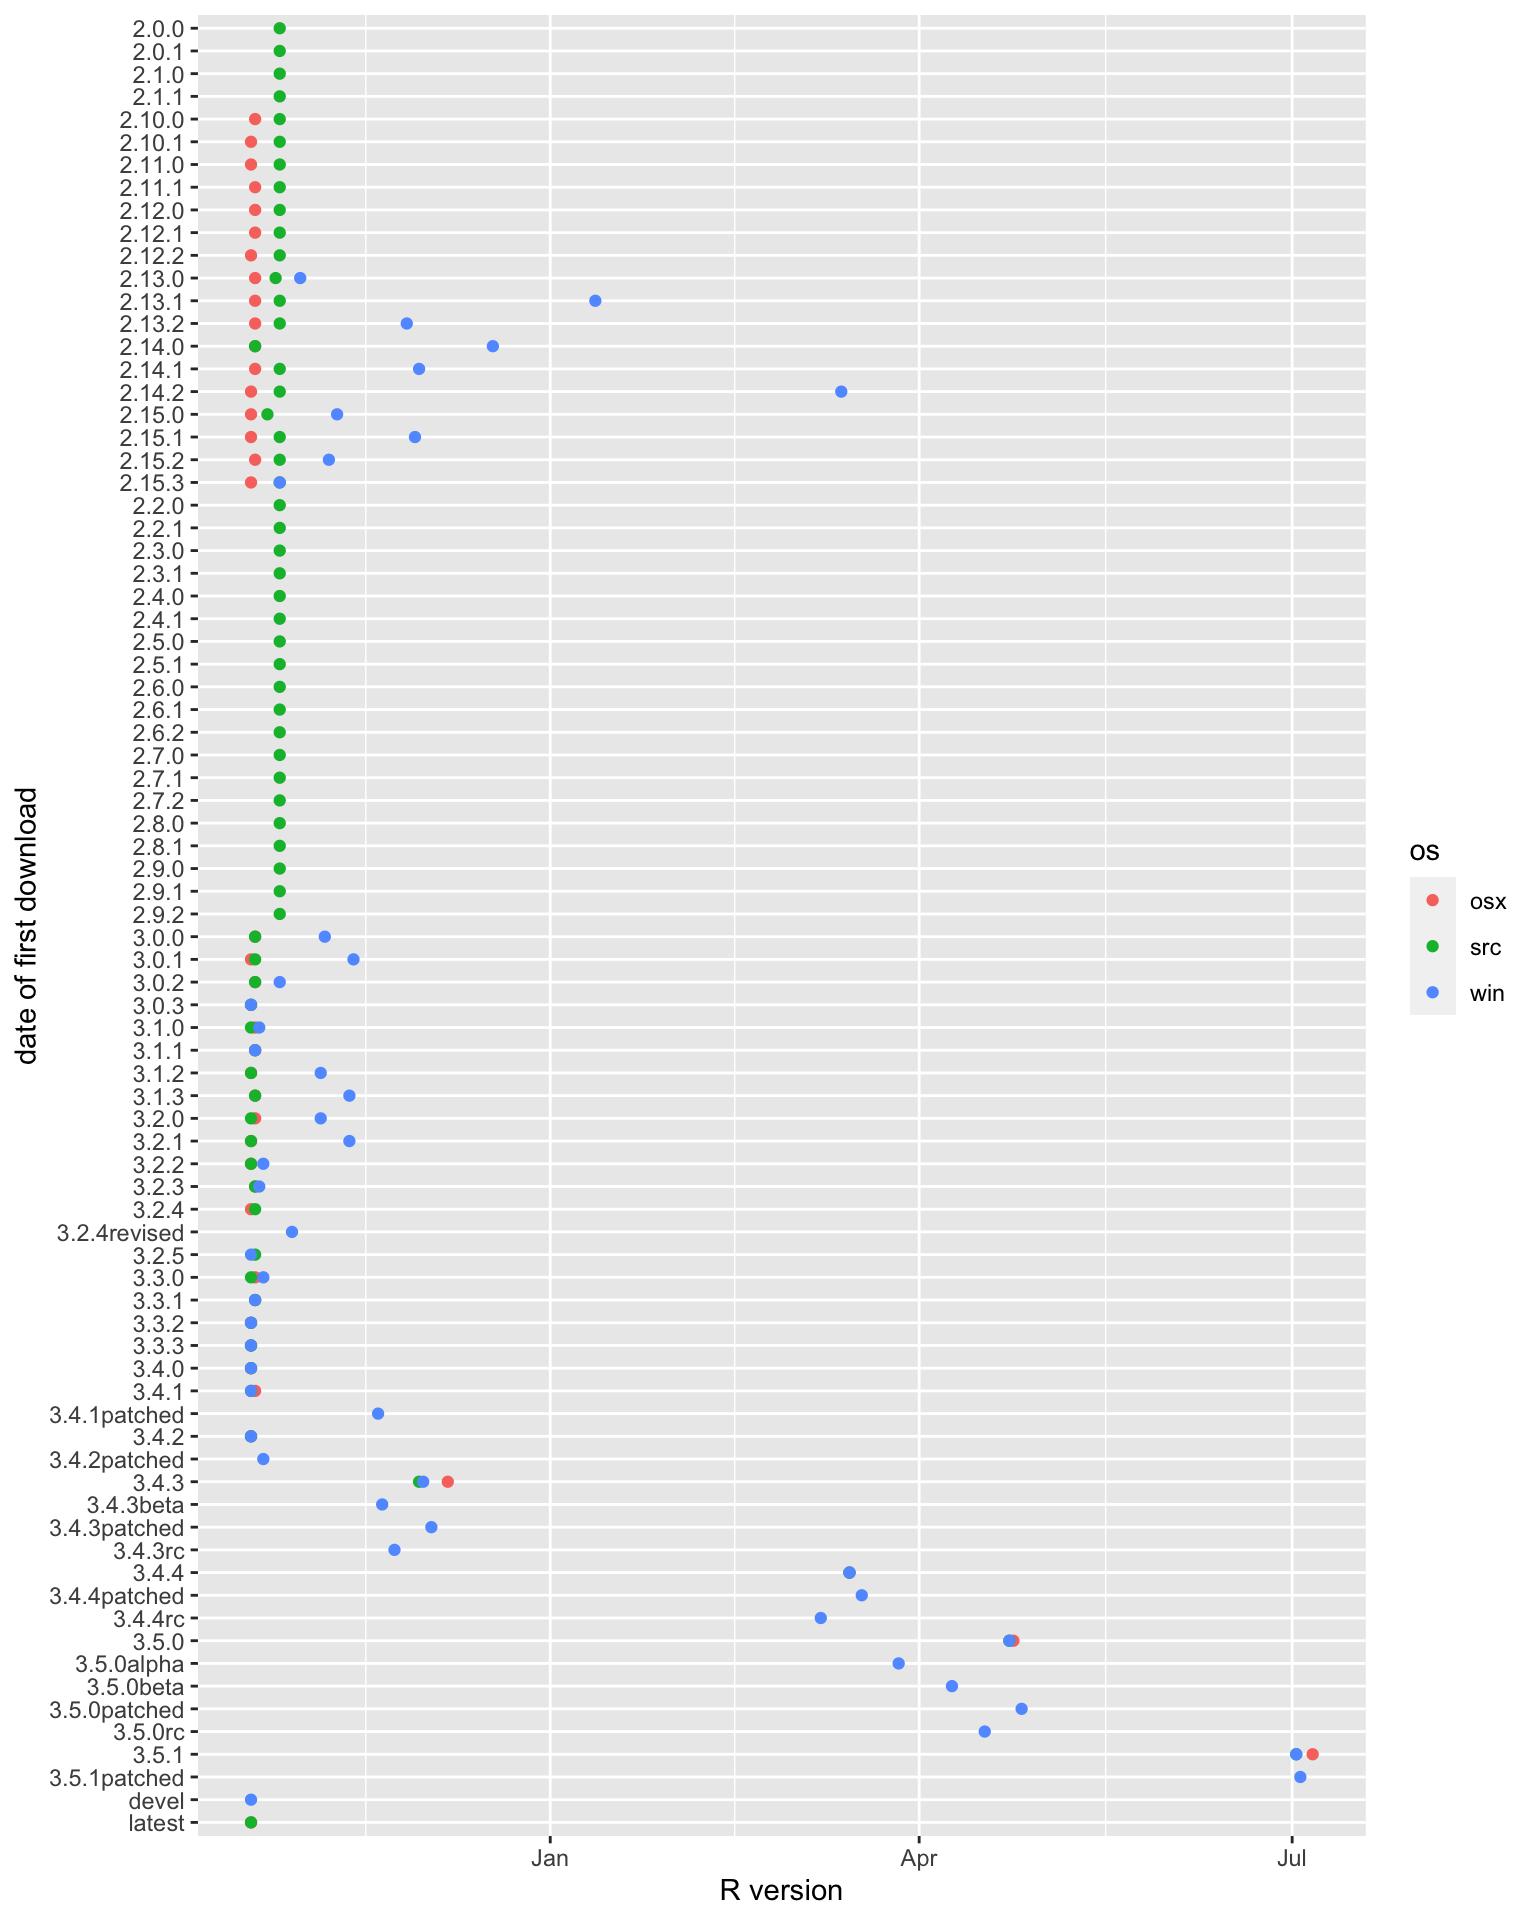
Take-Aways
- Windows often lags.
- I suspect “devel” and “latest” are relative to the current version since they appear early on.
Tidyverse and its components
tidyverse <- cran_downloads(package = "tidyverse", from = min(rd$date), to = max(rd$date))
ggpl <- cran_downloads(package = "ggplot2", from = min(rd$date), to = max(rd$date))
dp <- cran_downloads(package = "dplyr", from = min(rd$date), to = max(rd$date))
tid <- cran_downloads(package = "tidyr", from = min(rd$date), to = max(rd$date))
re <- cran_downloads(package = "readr", from = min(rd$date), to = max(rd$date))
pr <- cran_downloads(package = "purrr", from = min(rd$date), to = max(rd$date))
tib <- cran_downloads(package = "tibble", from = min(rd$date), to = max(rd$date))
st <- cran_downloads(package = "stringr", from = min(rd$date), to = max(rd$date))
fc <- cran_downloads(package = "forcats", from = min(rd$date), to = max(rd$date))


allTy <- rbind.data.frame(tidyverse, ggpl, dp, tid, re, pr, tib, st, fc)

## add a horizontal line representing mean, help us pick out different colors
orderV <- allTy %>%
  group_by(package) %>%
  summarise(mV = mean(count)) %>%
  arrange(mV)
ggplot(allTy, aes(date, count, col = package)) +
  geom_point(size = 2, alpha = .75) +
  geom_hline(data = orderV, aes(yintercept = mV, col = package), lwd = 2, lty = c(rep(1, 7), 2, 1)) +
  geom_vline(aes(xintercept = as.Date("2017-12-25")))
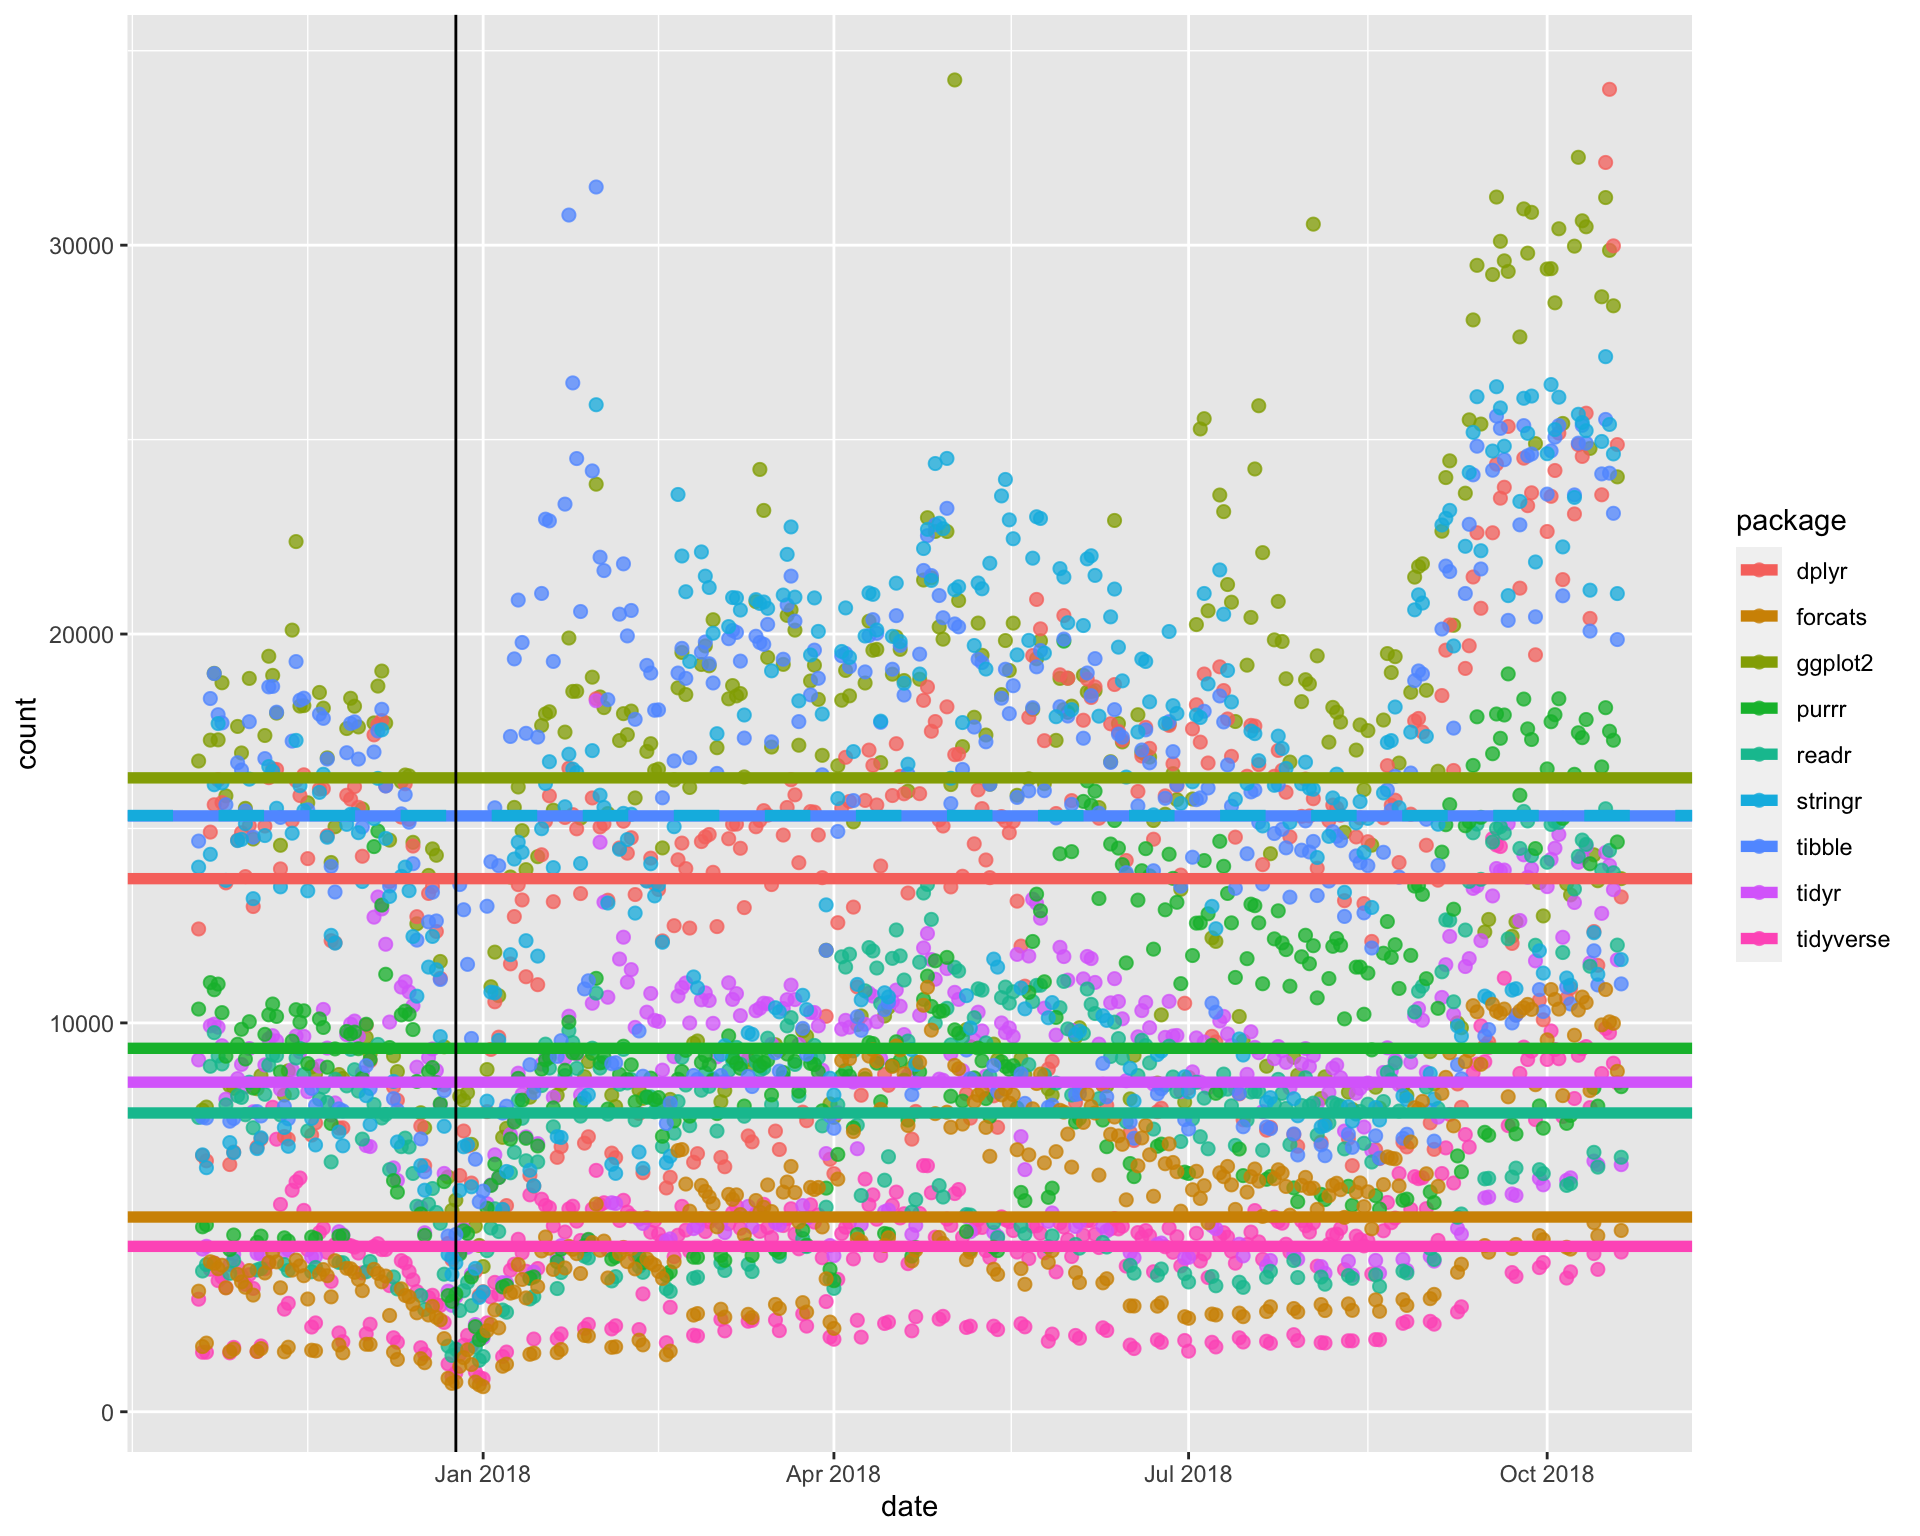
Note: stringr and tibble are on top of one another.
Take-Aways
The average number of downloads of
tidyverseis less than the average number of downloads for each of its components. This makes sense because we can either download all packages at once viatidyverseor download the components separately.ggplot2has the highest average number of downloads.stringrandtibblehave similar average number of downloads.- There is some evidence of a bit of work life balance as there is a noticeable drop off in downloads on Christmas.