Data: US Honey Production
Data Source: USDA
Data Source:Kaggle.com
Article: Bee Culture
Find my cleaning process for going from the three raw data files to my clean version here.
It’s a bit like… 
[1] "state"          "numColonies"    "yieldPerColony"
[4] "production"     "stocks"         "avgPricePerLb"
[7] "valProd"        "year"
By Year
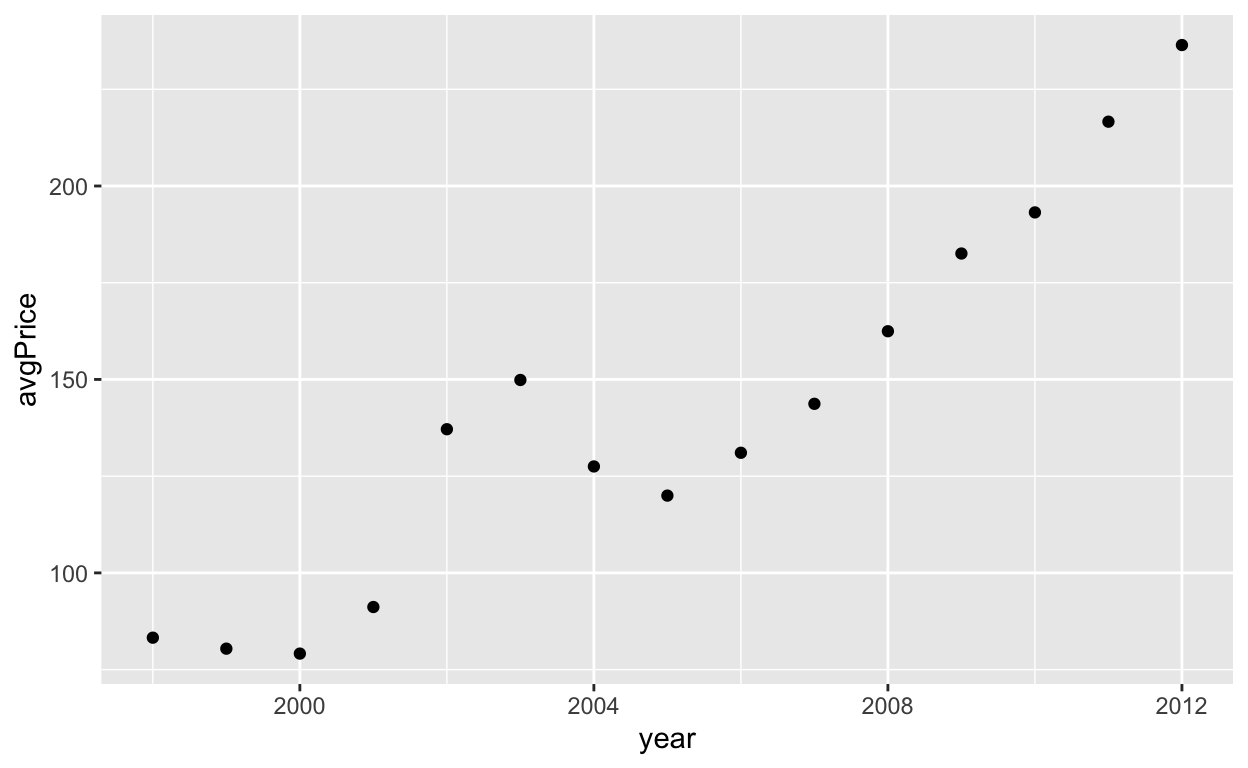
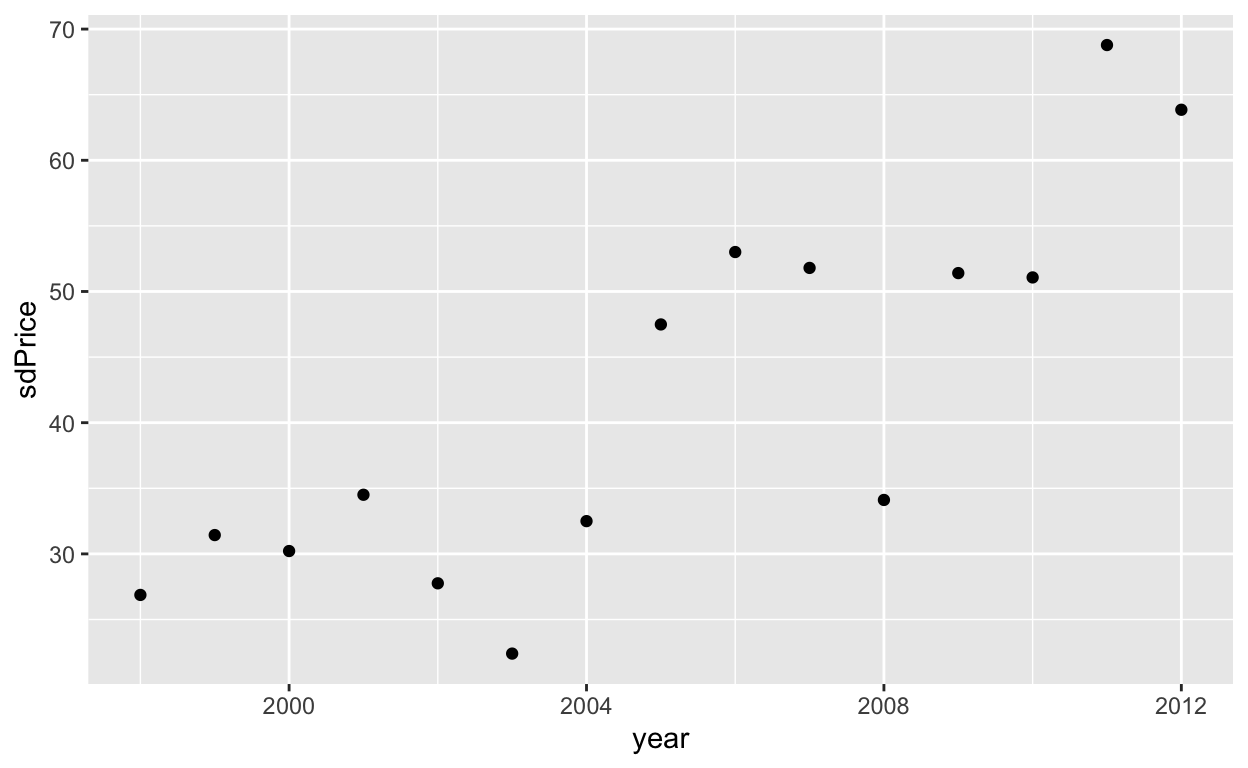
Supply and Demand
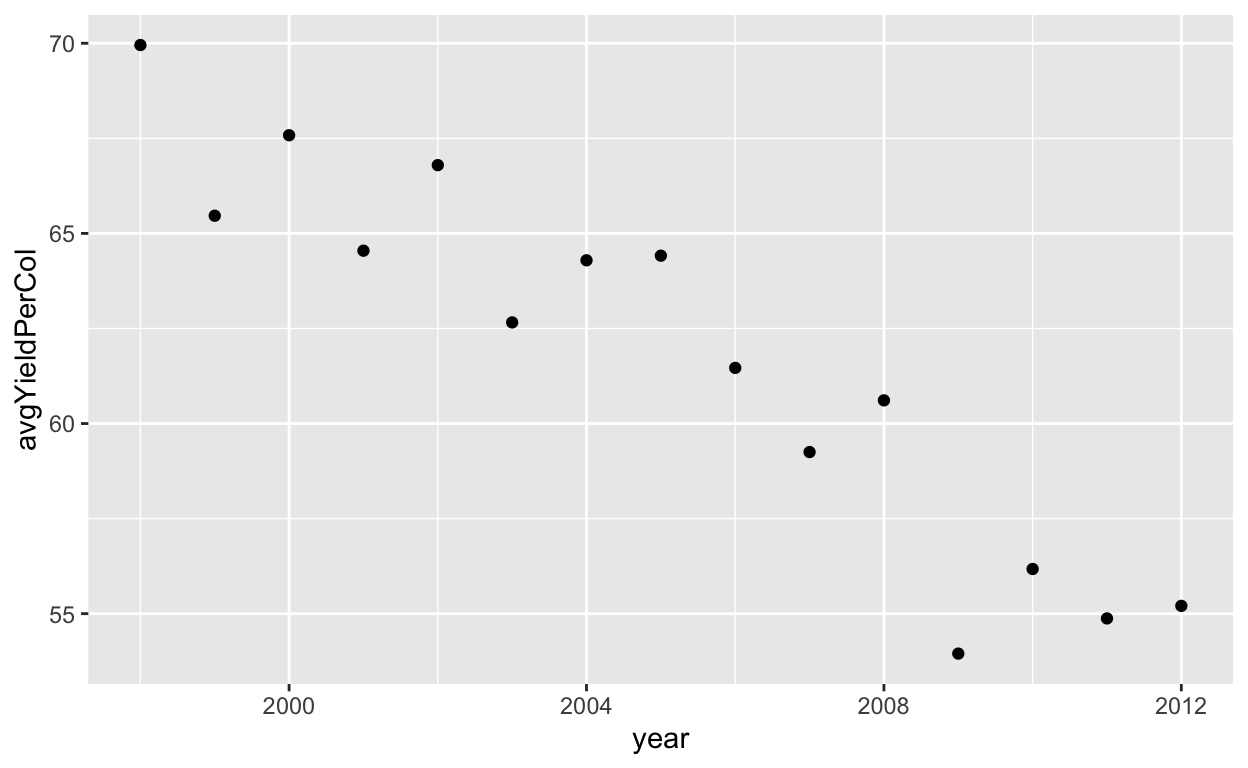
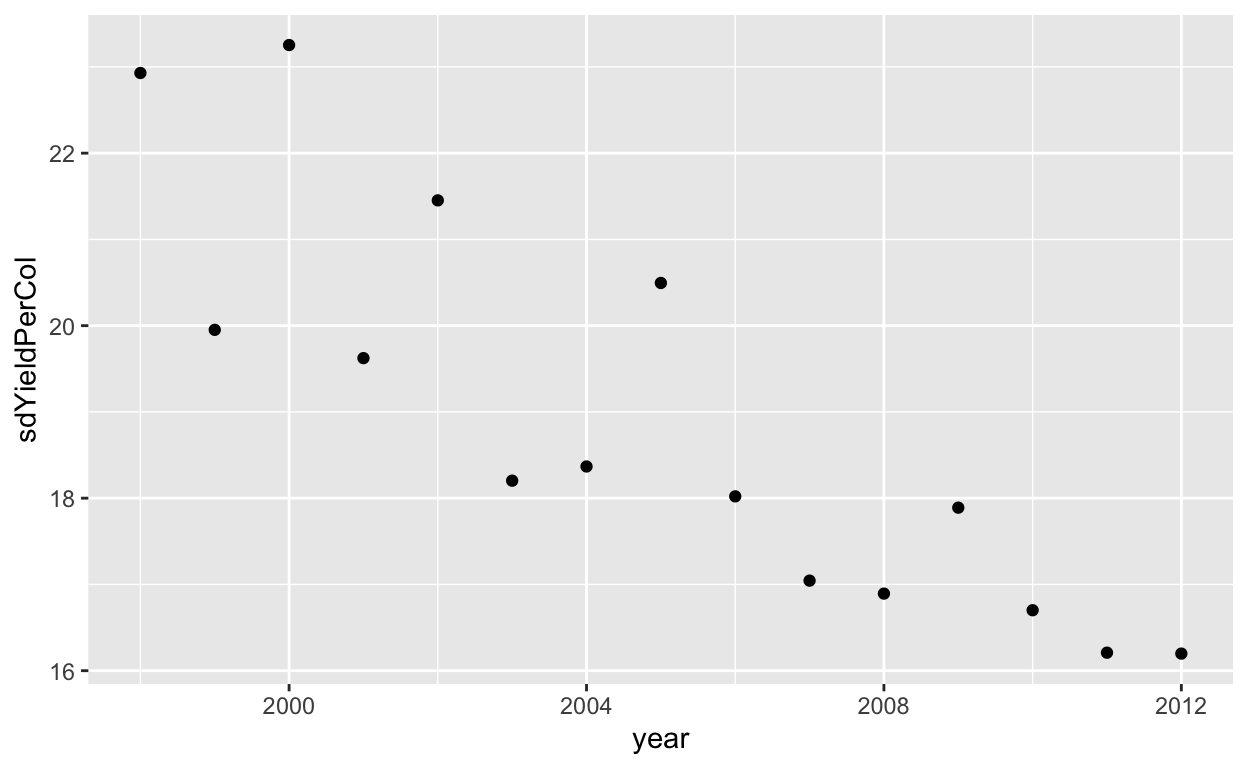
Efficiency
Take-Aways
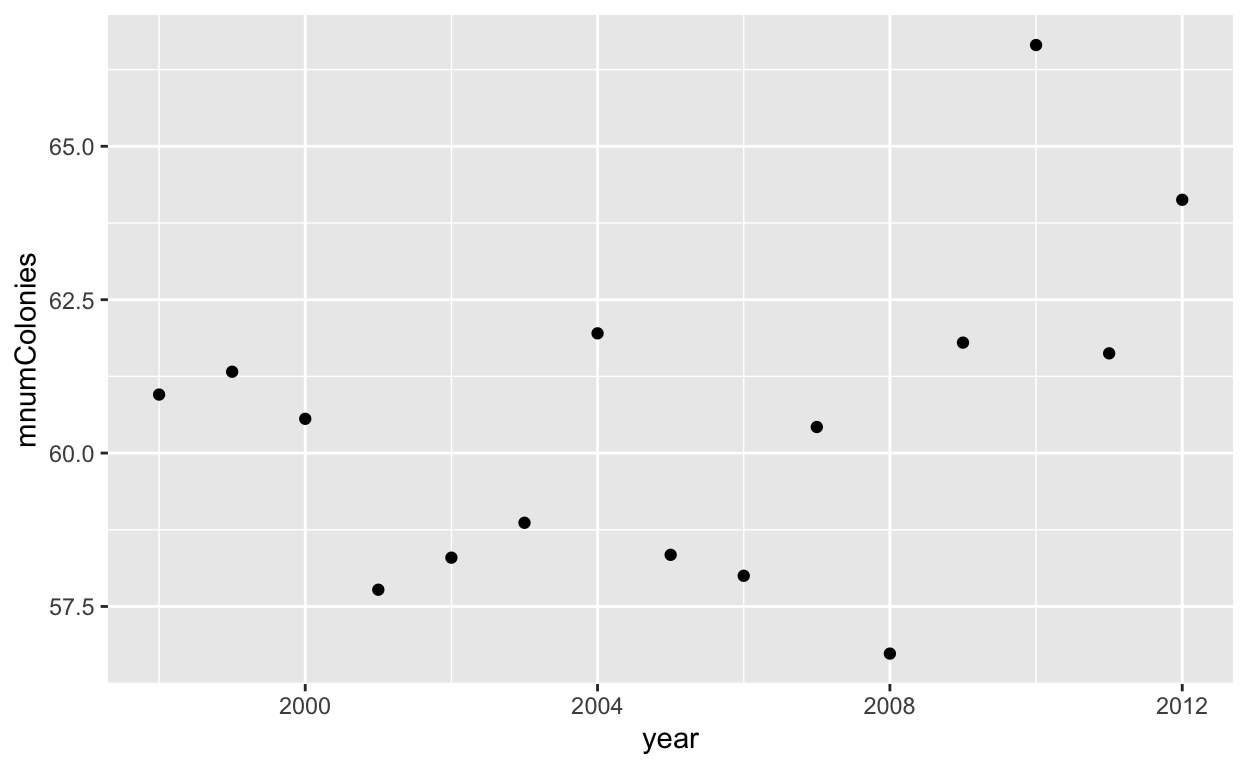
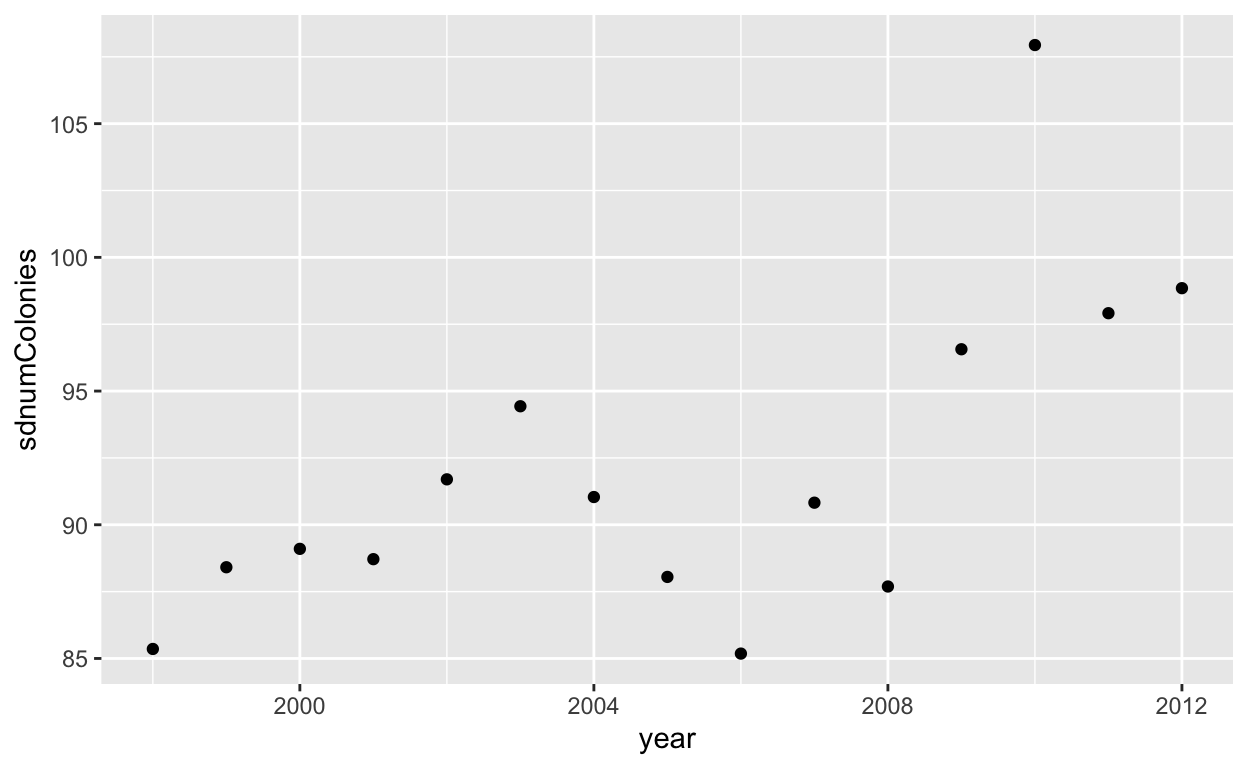
- Variability in number of colonies is increasing.
- Price is increasing.
- Efficiency (yield/colony) is declining.
By State
# A tibble: 6 x 11
state numColoniesT productionT avgPrice sdPrice avgYieldPerCol
<chr> <int> <int> <dbl> <dbl> <dbl>
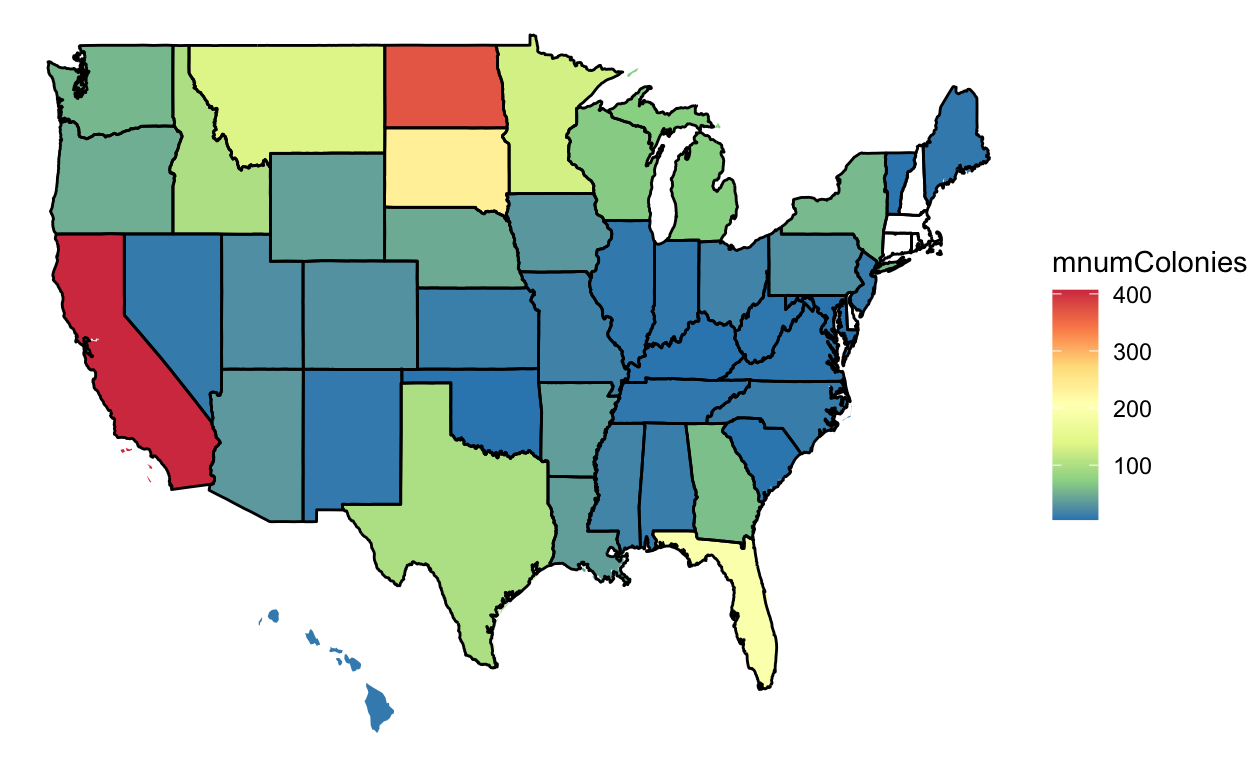
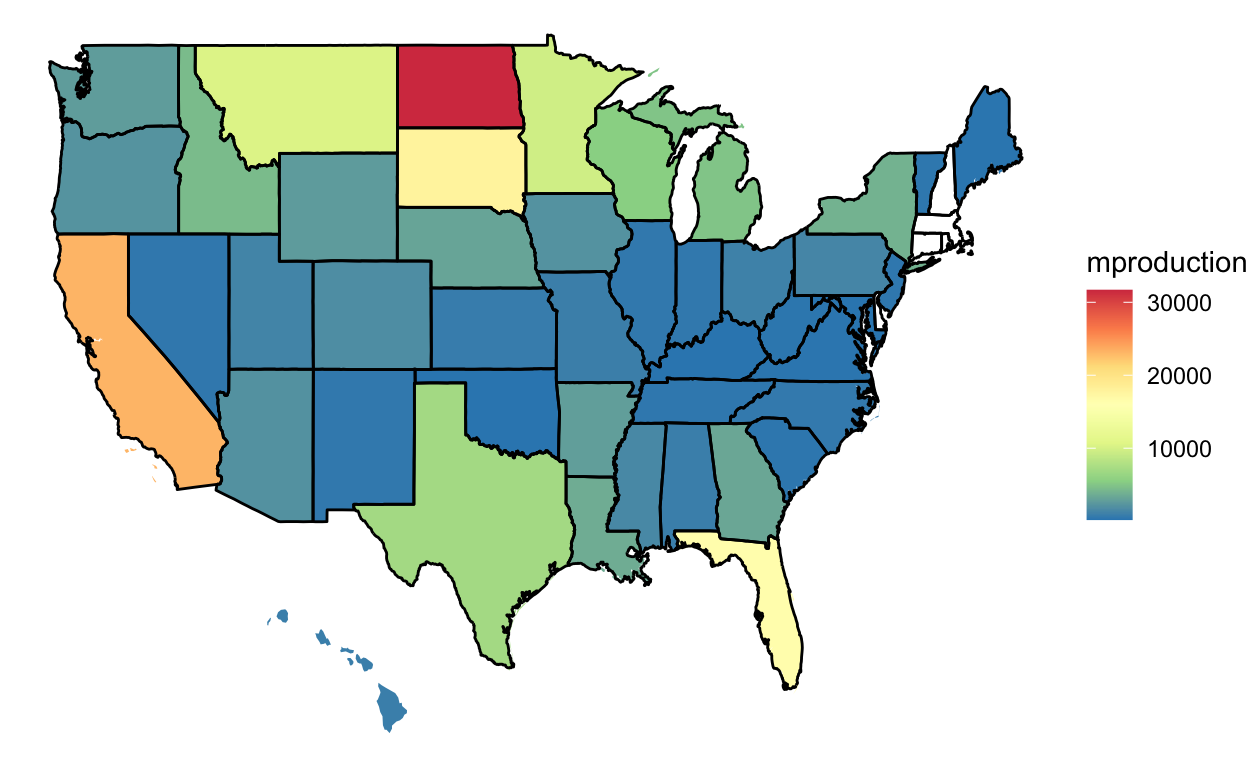
1 CA 6100 347535 113. 42.6 55.8
2 ND 5555 475085 113. 42.7 88.1
3 SD 3544 266141 114 43.1 75.8
4 FL 2928 247048 110. 41.7 83.1
5 MT 2040 156562 115. 43.7 77.3
6 MN 1934 144360 115. 42.8 74.3
# … with 5 more variables: sdYieldPerCol <dbl>, mnumColonies <dbl>,
# mproduction <dbl>, sdnumColonies <dbl>, sdproduction <dbl># A tibble: 6 x 11
state numColoniesT productionT avgPrice sdPrice avgYieldPerCol
<chr> <int> <int> <dbl> <dbl> <dbl>
1 ND 5555 475085 113. 42.7 88.1
2 CA 6100 347535 113. 42.6 55.8
3 SD 3544 266141 114 43.1 75.8
4 FL 2928 247048 110. 41.7 83.1
5 MT 2040 156562 115. 43.7 77.3
6 MN 1934 144360 115. 42.8 74.3
# … with 5 more variables: sdYieldPerCol <dbl>, mnumColonies <dbl>,
# mproduction <dbl>, sdnumColonies <dbl>, sdproduction <dbl># A tibble: 6 x 11
state numColoniesT productionT avgPrice sdPrice avgYieldPerCol
<chr> <int> <int> <dbl> <dbl> <dbl>
1 VA 99 3998 232 93.4 40.2
2 NV 108 4832 222. 76.2 45.2
3 IL 121 7475 214. 83.8 61.7
4 KY 66 3445 208. 64.5 52.1
5 NC 171 8141 207. 67.7 47.8
6 TN 108 6116 189. 56.1 56.3
# … with 5 more variables: sdYieldPerCol <dbl>, mnumColonies <dbl>,
# mproduction <dbl>, sdnumColonies <dbl>, sdproduction <dbl># A tibble: 6 x 11
state numColoniesT productionT avgPrice sdPrice avgYieldPerCol
<chr> <int> <int> <dbl> <dbl> <dbl>
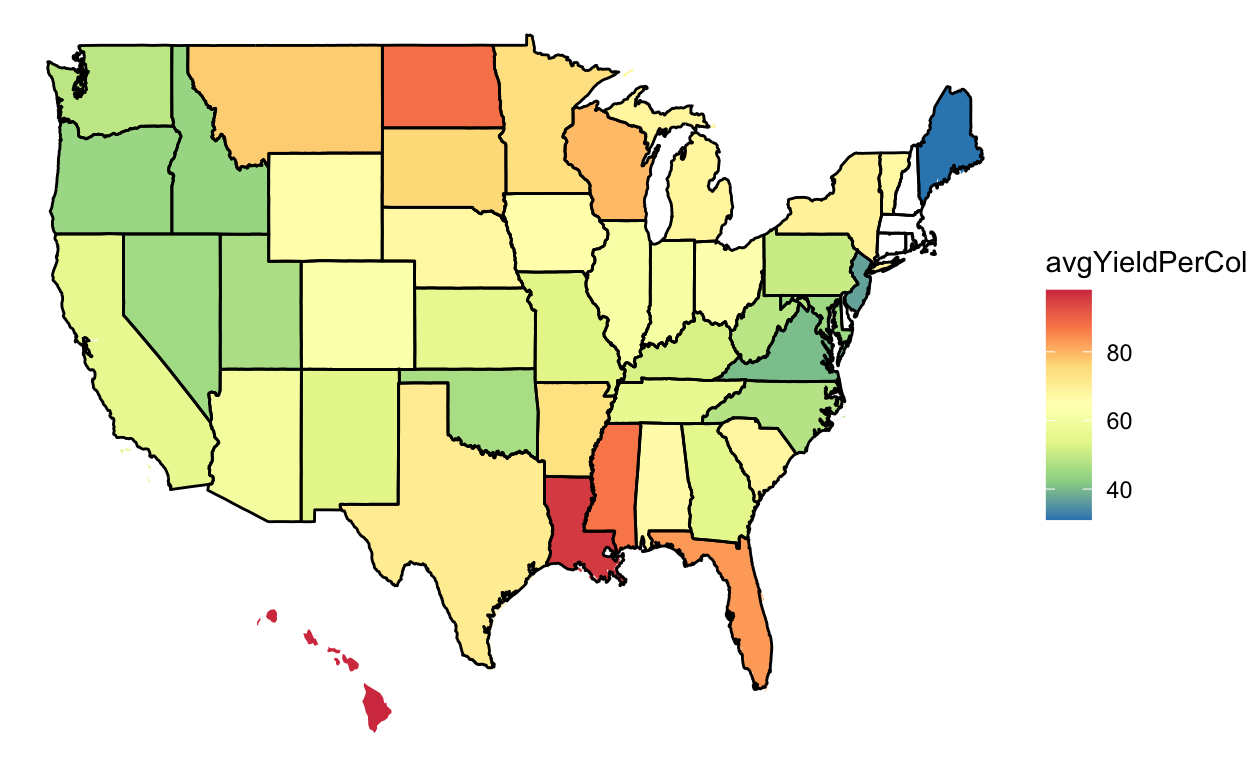
1 HI 131 12647 171 103. 98
2 LA 565 54410 105. 43.5 95.7
3 ND 5555 475085 113. 42.7 88.1
4 MS 252 21853 106. 37.9 87.5
5 FL 2928 247048 110. 41.7 83.1
6 WI 1022 81833 127. 43.1 79.4
# … with 5 more variables: sdYieldPerCol <dbl>, mnumColonies <dbl>,
# mproduction <dbl>, sdnumColonies <dbl>, sdproduction <dbl>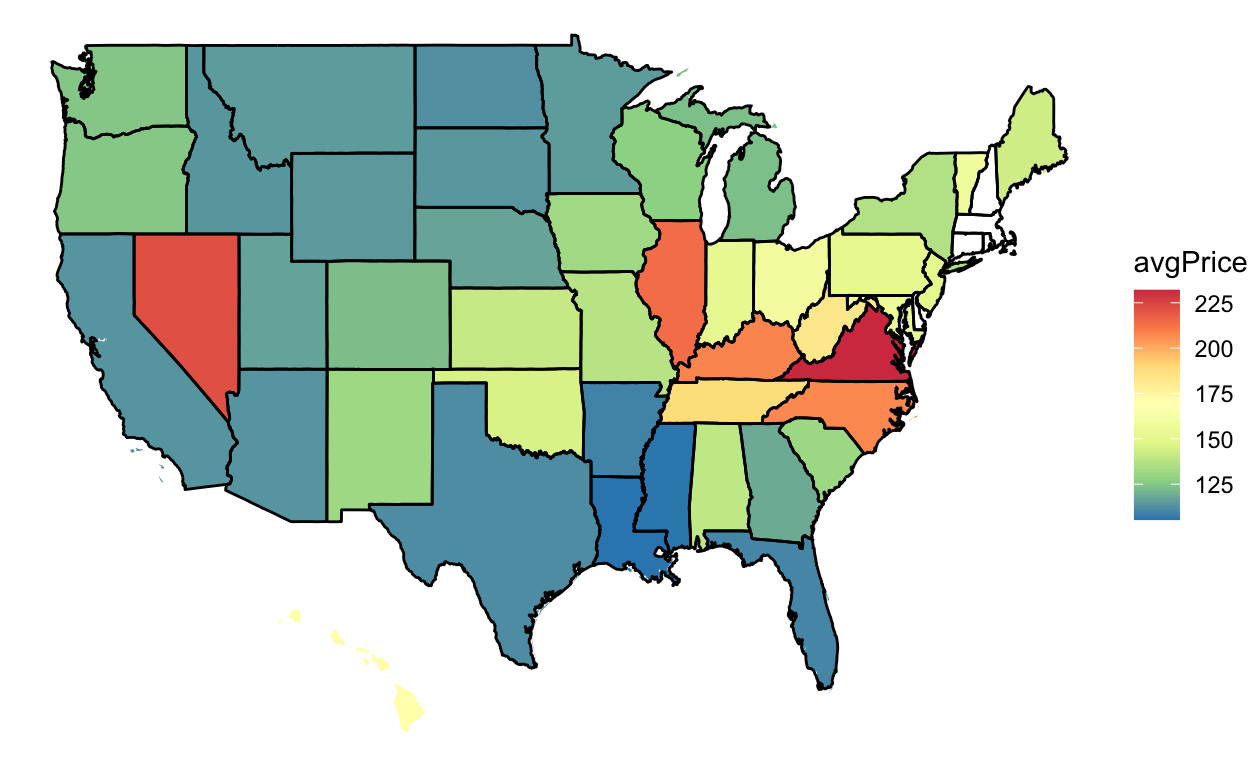
Take-Aways
I don’t know anything about honey/bees, so maybe these are obvious but I’m surprised by:
- the high price in the mid east coast states.
- the large number of colonies and production in North Dakota
- the high efficiency in Louisiana and North Dakota.
By State Over Time
Time for some fancy geofacets!
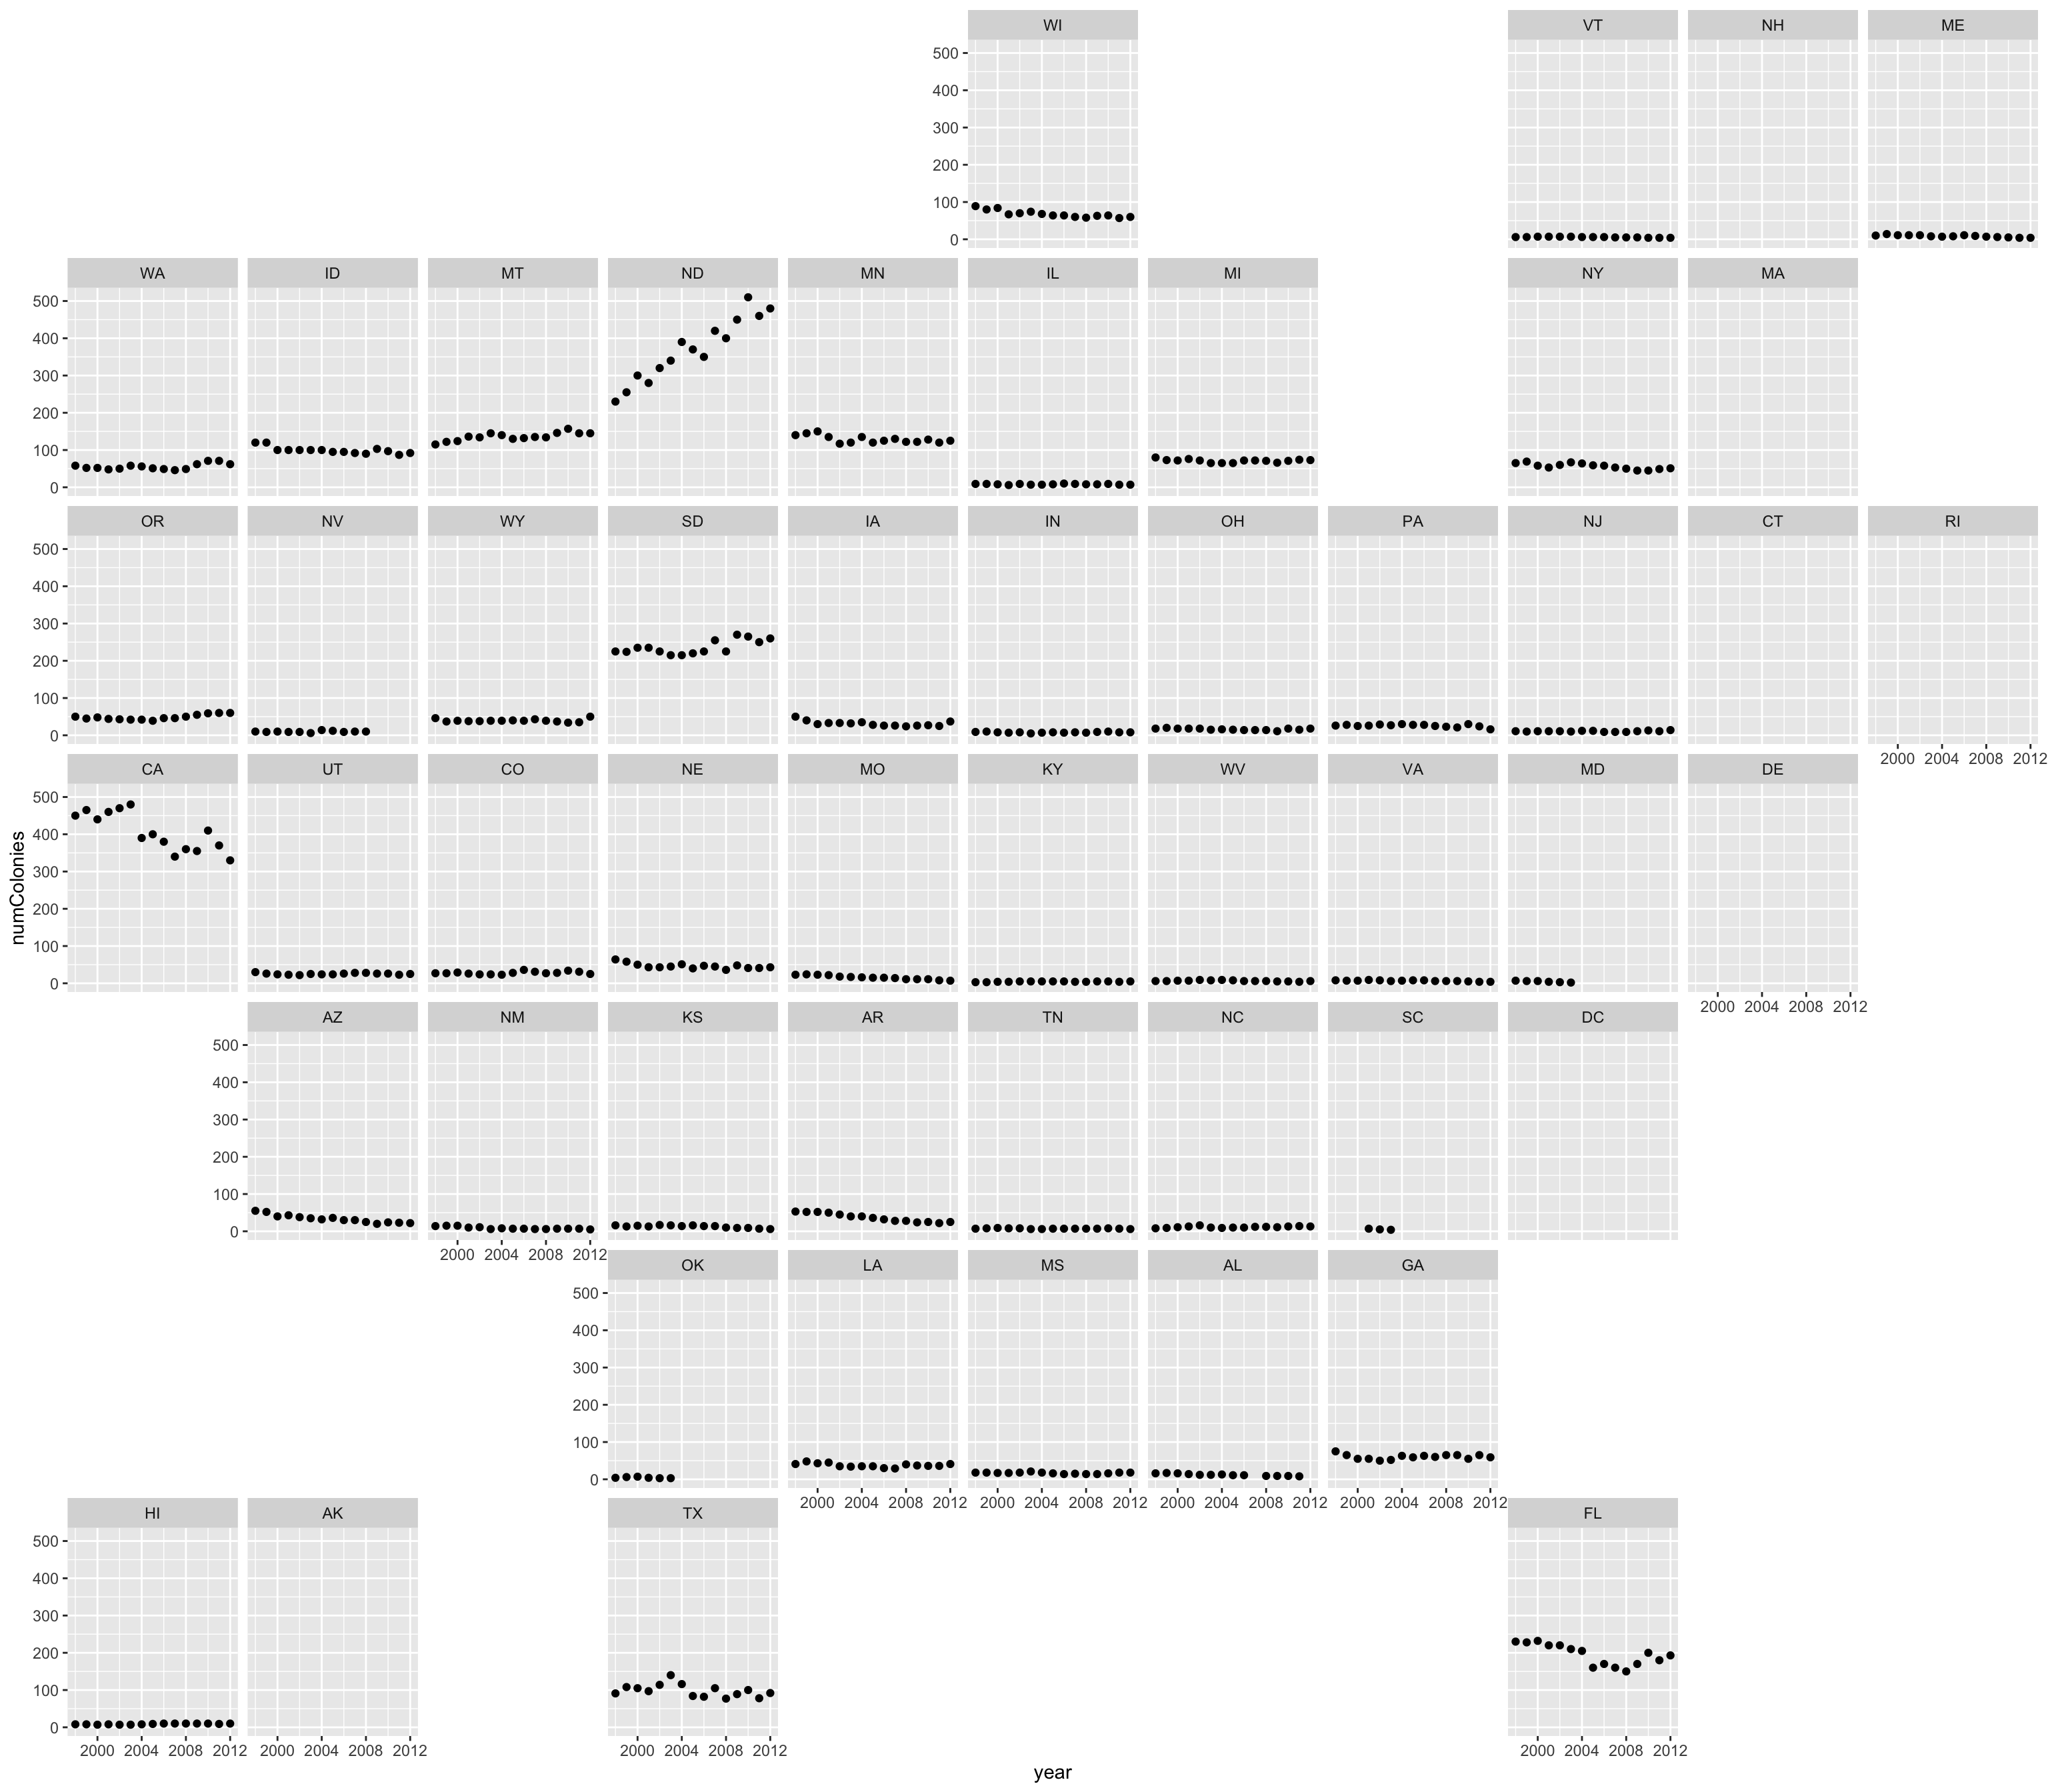
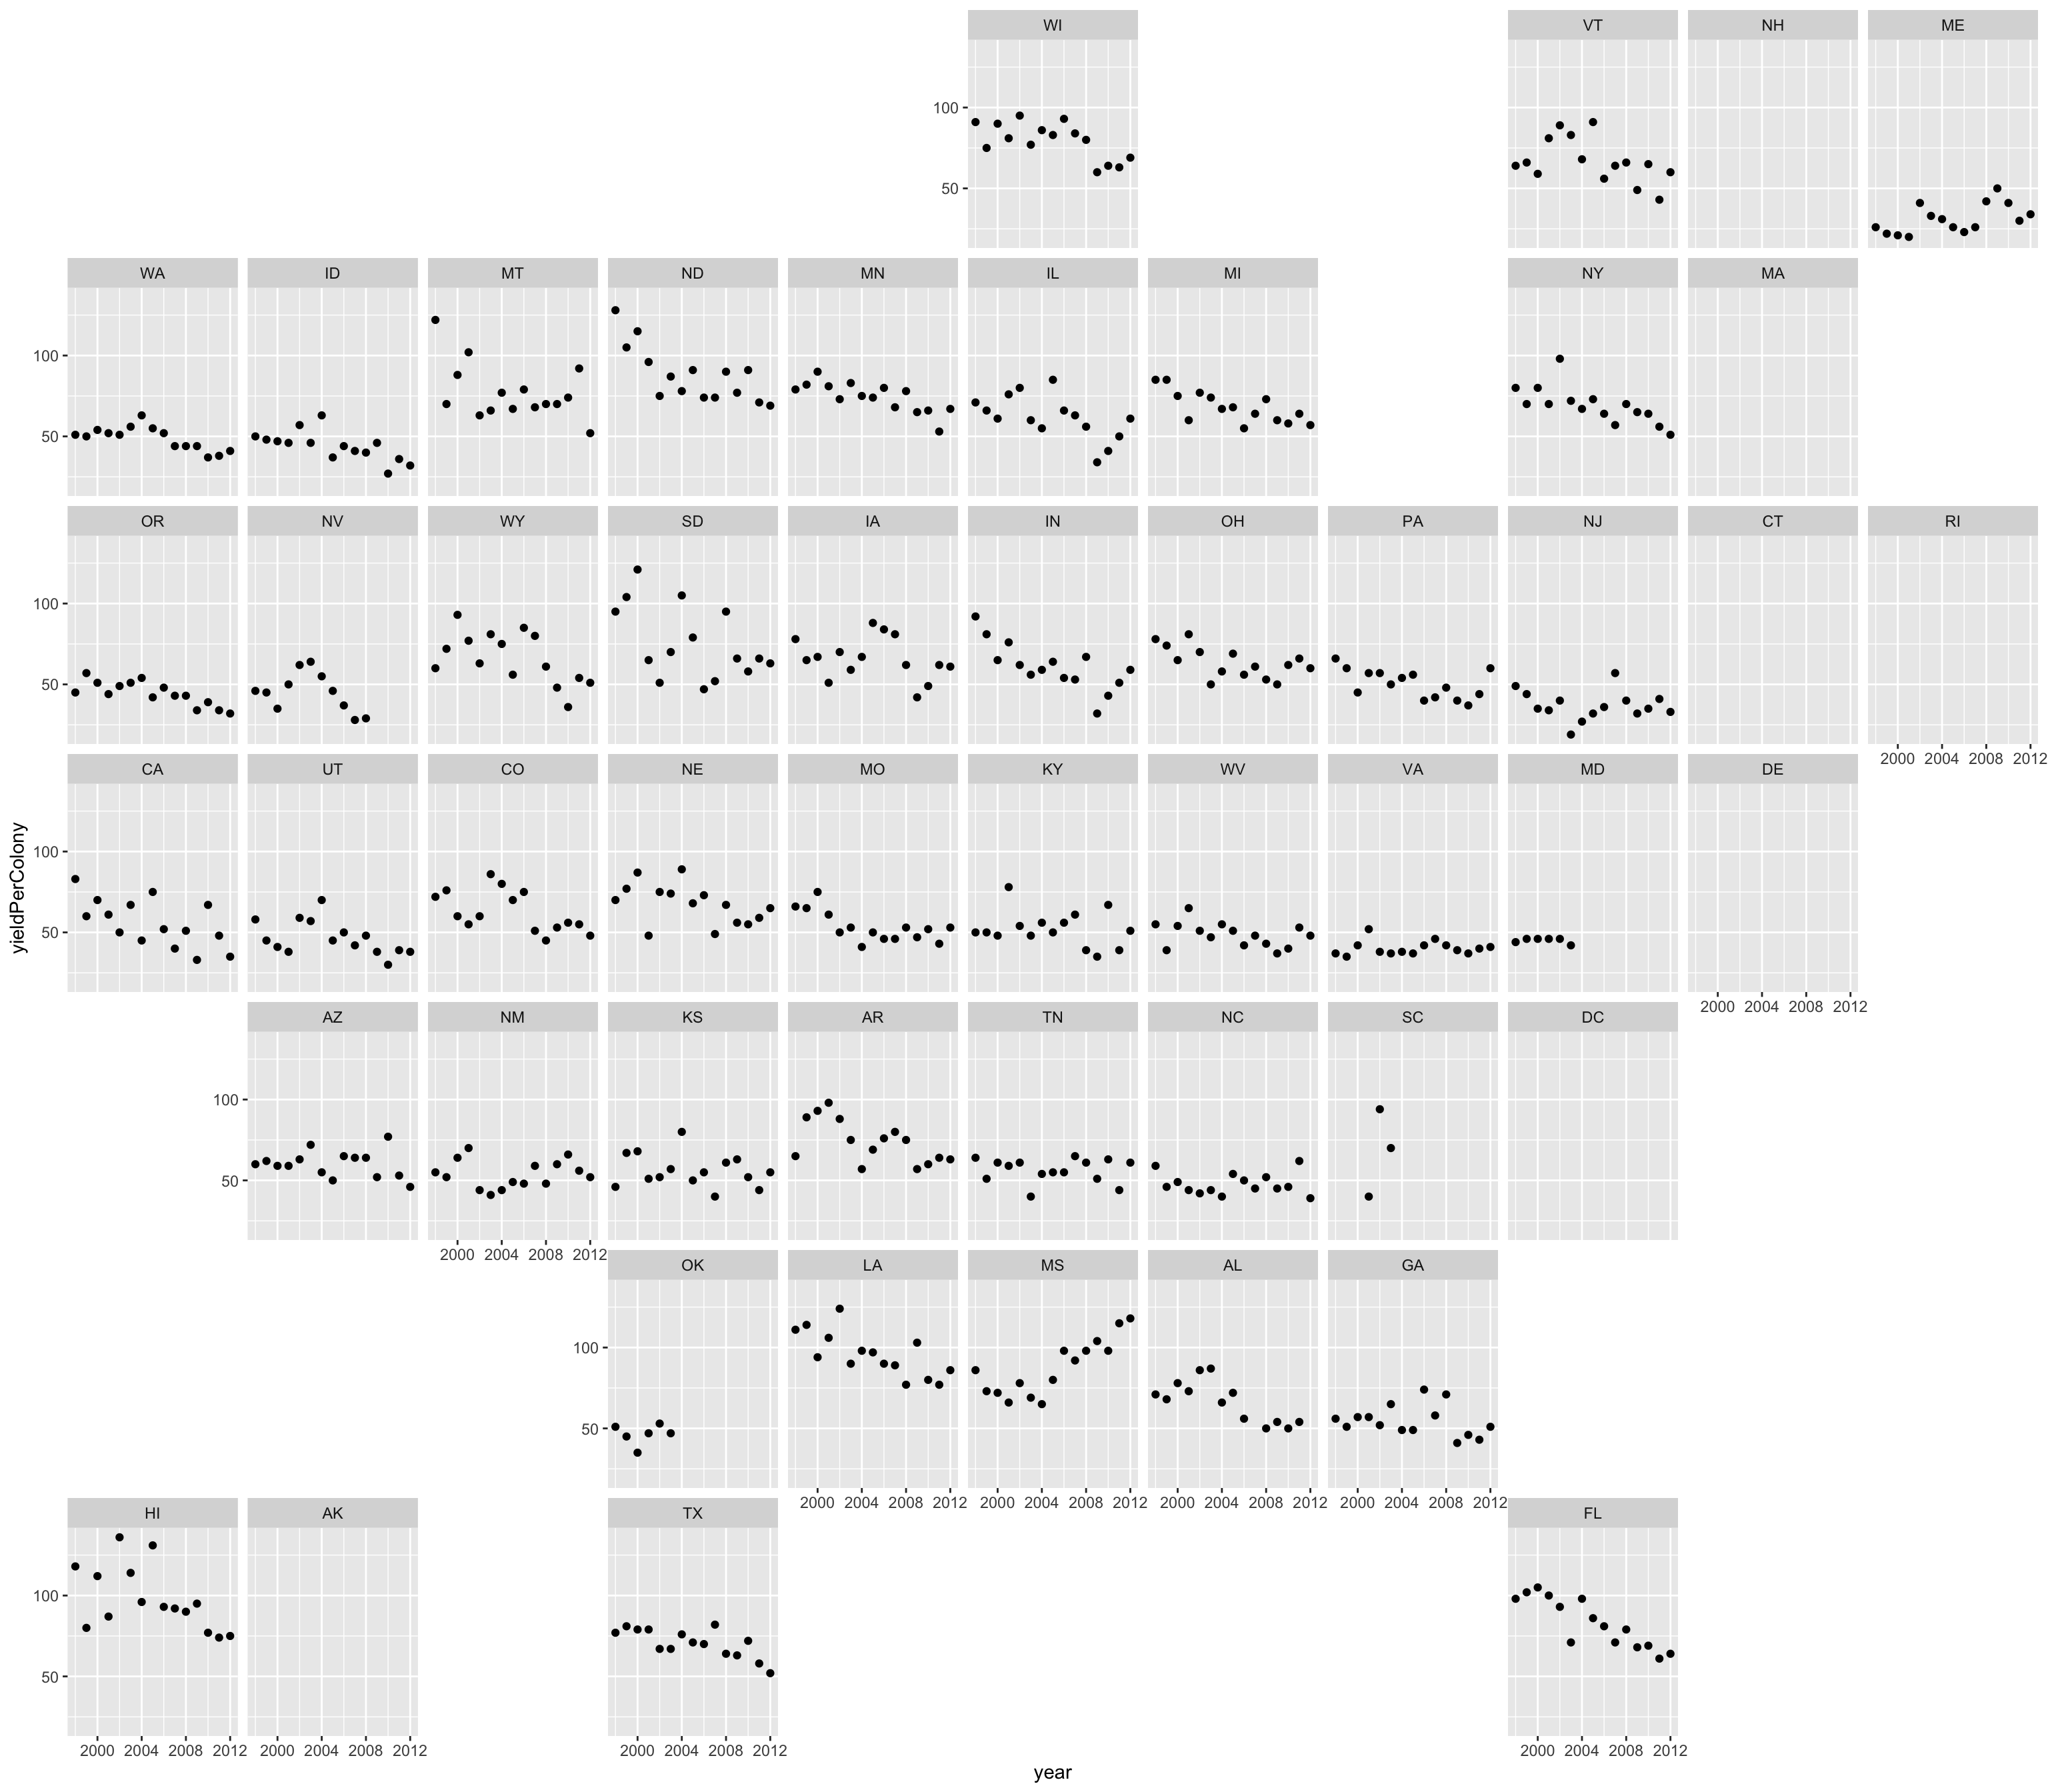
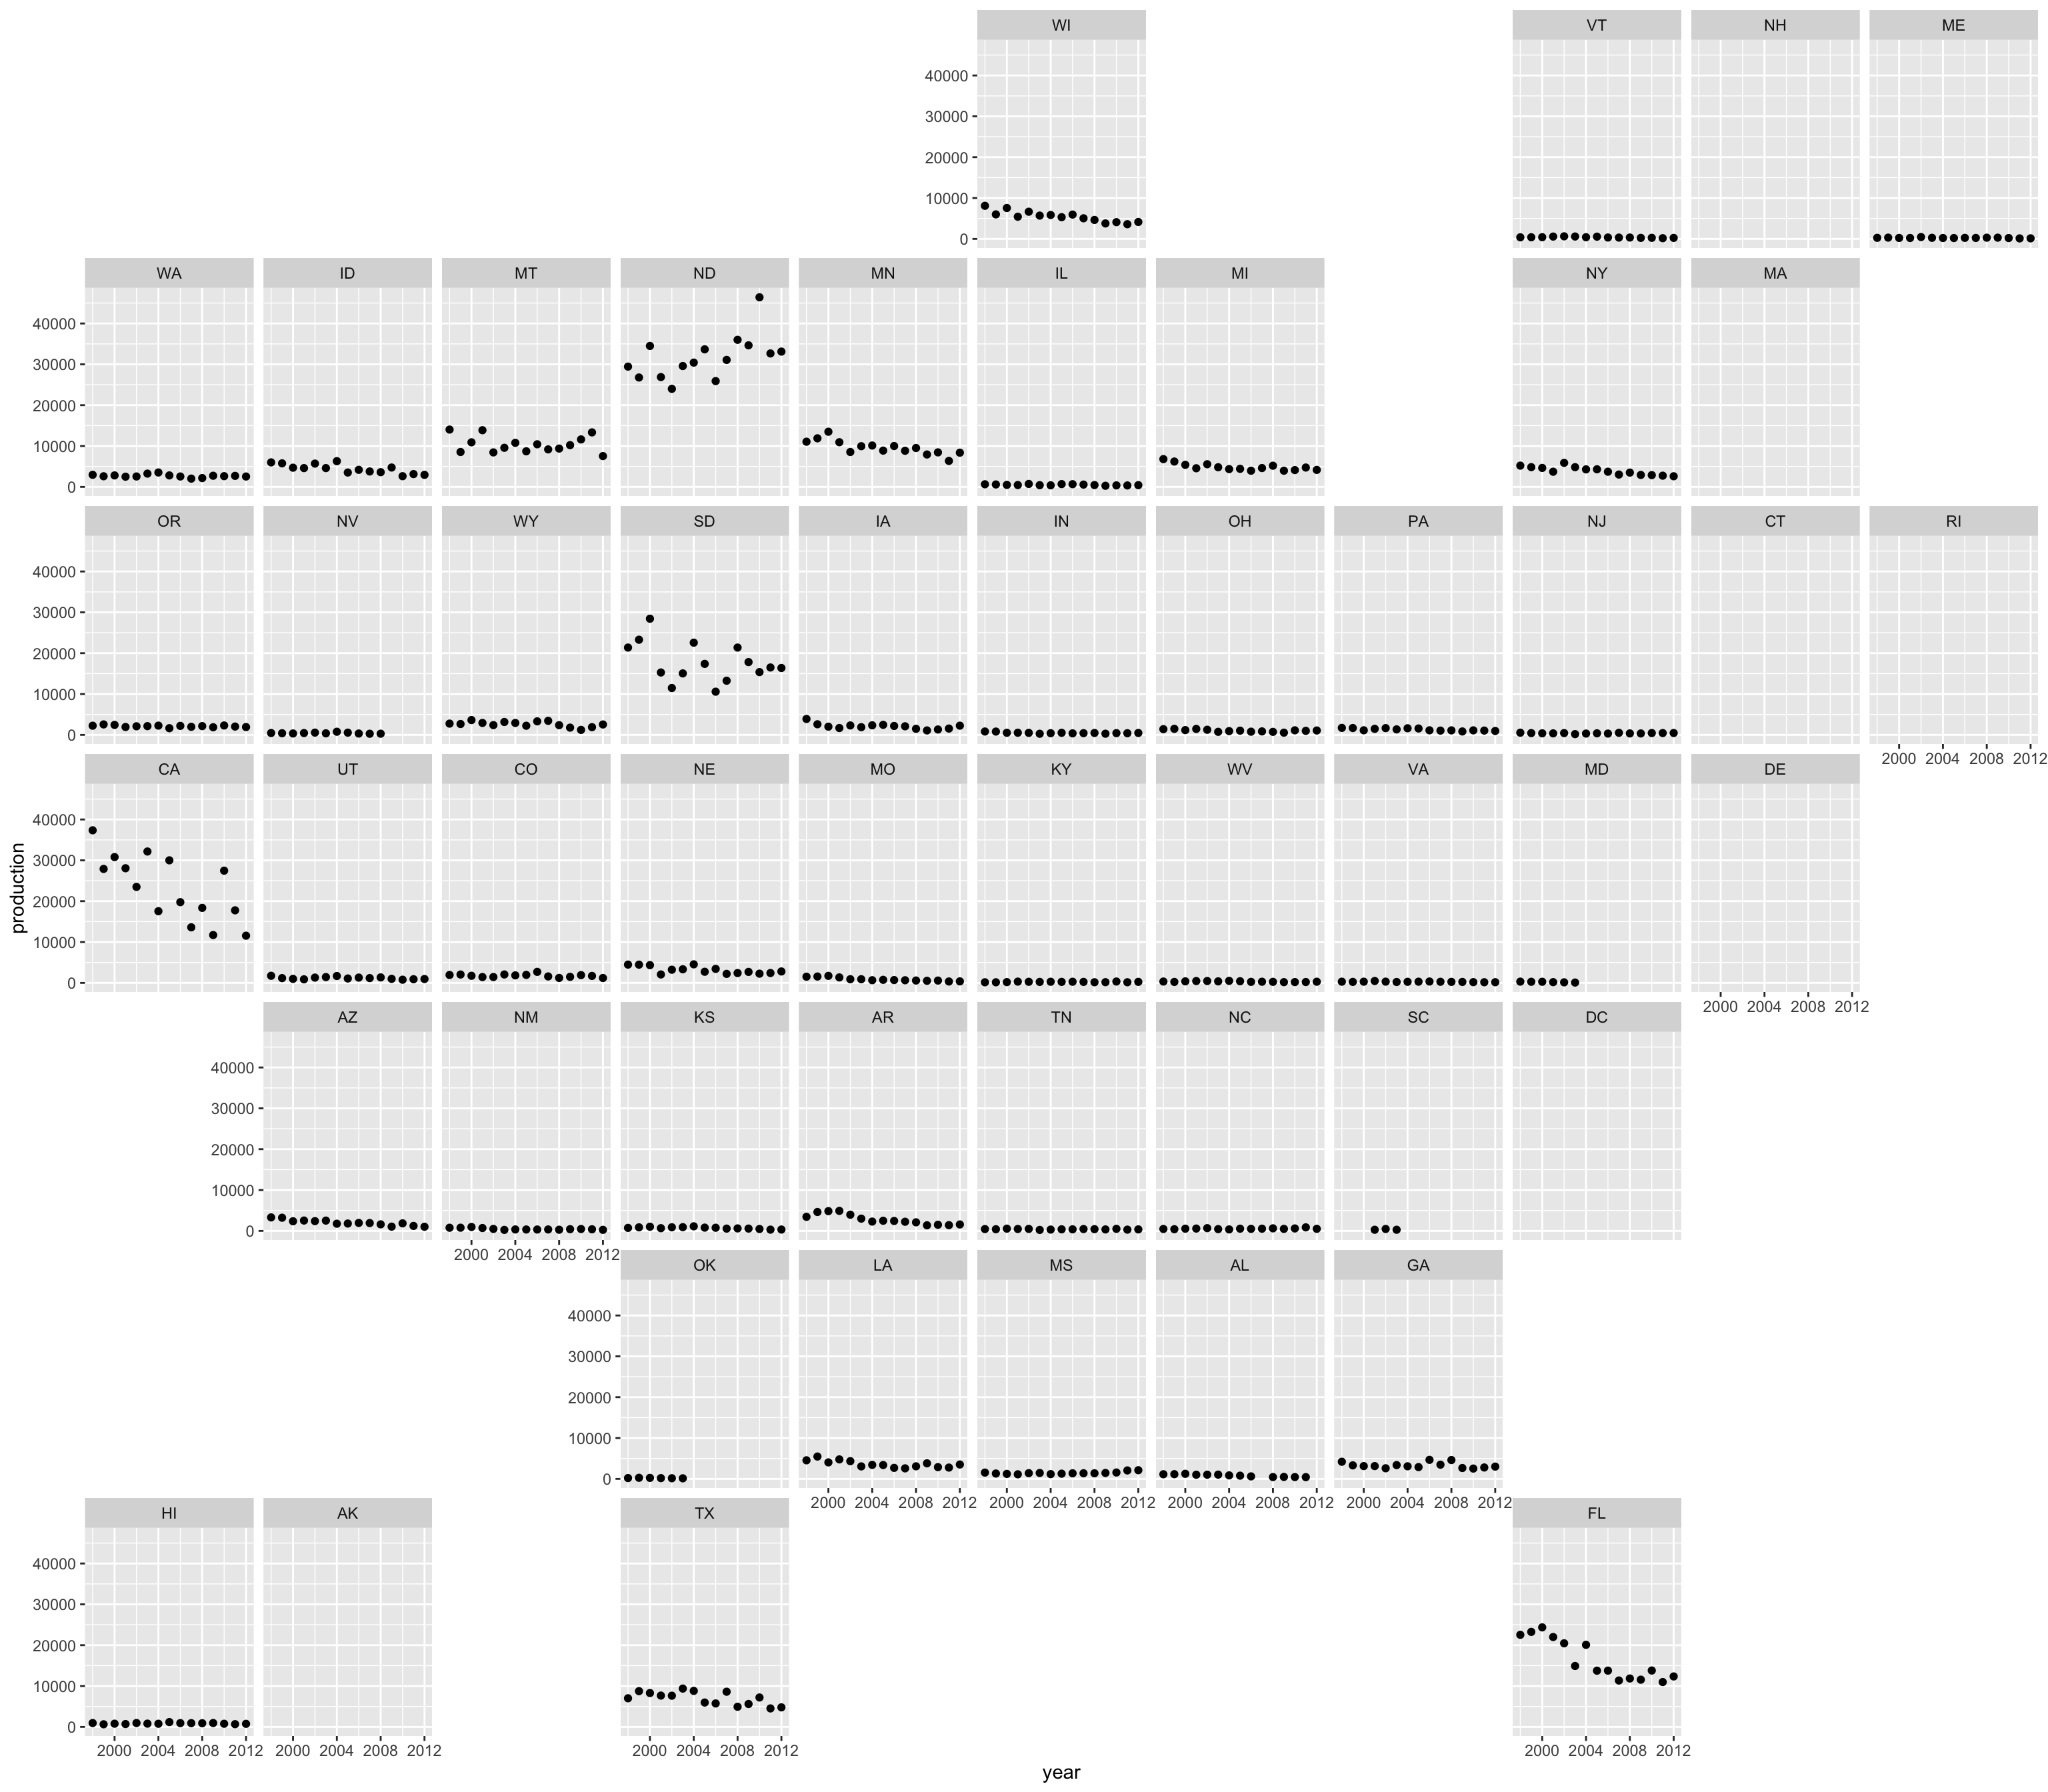

Take-Aways
- Number of Colonies and Production: North Dakota is on the rise; California is on the decline.
- Louisiana’s high efficiency is on the decline while Mississippi’s is on the rise. Florida and Hawaii are also suffering.
- Price increases are fairly similar across all of the states.